
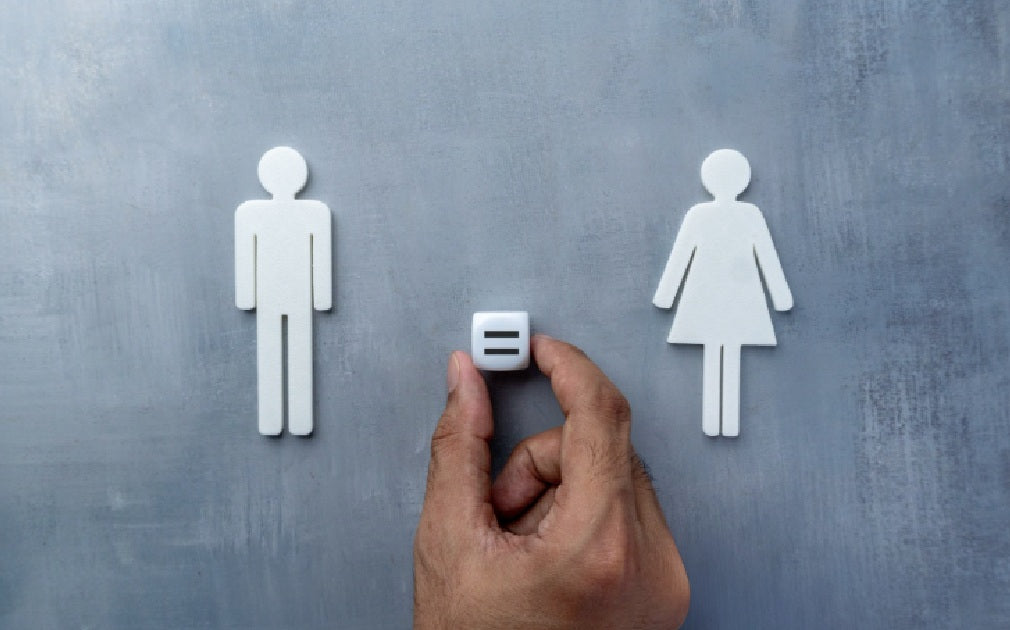
Progress on workplace gender equality across 33 OECD nations has slowed to its weakest level since the pandemic, full-time work for women is falling, and in the United Kingdom nearly one million young people are now disconnected from work and study, with young women driving the rise. Australia, by contrast, has climbed from 19th to 10th on PwC's index, largely by making employer pay gaps public. This article examines what the 2026 Women in Work Index and Australia's Workplace Gender Equality Agency data reveal, and what it means for RTOs, training providers, employers and the young women whose pathways are decided long before they reach the labour market.
The Numbers Behind the Silence
Progress on gender equality at work across 33 Organisation for Economic Co-operation and Development nations has slowed to its weakest level since the pandemic. Full-time employment for women has fallen. Female unemployment has risen. And the group absorbing the sharpest impact is the one the global economy can least afford to lose: young women.
These are not opinions. They are the findings of PwC's Women in Work Index 2026, now in its fifteenth year, which tracks five indicators across 33 OECD countries: the gender pay gap, the female labour force participation rate, the gap between male and female participation, the female unemployment rate, and the female full-time employment rate. This article examines those findings, places them alongside Australia's own gender equality data released by the Workplace Gender Equality Agency in March 2026, and asks what these numbers mean for anyone who works in, leads or shapes education and training systems. Every statistic cited is drawn from publicly available, independently published sources, listed at the end of this article.
1. The Global Picture: Progress at Its Weakest Since the Pandemic
The OECD average improvement was just 0.6 points, half the average annual improvement since the index began in 2011, and the smallest gain since the pandemic disrupted global labour markets in 2020. This slowdown was driven by a historic fall in full-time employment for women and rising unemployment across multiple economies. What separates the leaders from the rest is not a single policy or cultural characteristic. PwC's analysis identifies the consistent presence of supportive parental leave and affordable childcare as the structural foundations that enable women to remain in the workforce and progress within it. The following table sets out the headline picture.
|
Women in Work Index 2026 |
Detail |
|
Top five (unchanged for five years) |
Iceland, Luxembourg, New Zealand, Sweden, Slovenia |
|
Lowest five |
Mexico, Korea, Chile, Italy, Greece |
|
OECD trend |
Weakest progress since the pandemic, driven by falling full-time employment for women and rising unemployment |
|
United Kingdom |
17th, the top-ranked G7 country, but largely because others slipped |
|
Australia |
10th, up from 19th in 2020, among the largest improvements in the index |
The broader shift toward part-time work across OECD nations is a significant feature of this year's data. In many economies, the full-time employment rate for women has declined as employers restructure roles and as high childcare costs push women into reduced-hours arrangements. This is not a benign trend. Part-time employment typically carries lower hourly rates, fewer progression opportunities, reduced superannuation contributions and weaker job security. When full-time work declines for women, the long-term consequences extend well beyond the immediate pay packet, compressing lifetime earnings, retirement savings and financial independence.
2. The United Kingdom: Progress by Default
The UK has risen one place to 17th in the 2026 index, reclaiming its position as the top-ranked G7 country for women's economic empowerment. On the surface, this appears positive. Beneath the headline, the picture is considerably more concerning, because the rise was driven largely by declines in other countries' performance rather than by significant domestic improvement. The following table sets out the UK's readings.
|
UK indicator |
2026 reading |
|
Index ranking |
17th of 33, the top-ranked G7 country |
|
Index score change |
up 0.16 points, below the OECD average increase of 0.42 |
|
Female unemployment |
up from 3.5% to 4.2%, the largest annual rise since the index began in 2011 |
|
Youth female unemployment |
up from 9.5% to 11.8% |
|
Full-time employment rate, women |
down 1.2 percentage points to 67.7% |
|
Gender pay gap |
narrowed from 13.3% to 13.1%, still above the OECD average of 12.4% |
PwC's analysis described the situation in plain terms: rising female unemployment, especially among young women, points to underlying weaknesses in the UK labour market at a time when AI is reshaping the economy and the skills it demands, and the countries that succeed will be those that invest in strong educational foundations and continued skills development. That framing, from a major professional services firm rather than an advocacy group, is itself notable.
3. The NEET Crisis: Nearly One Million Young People Disconnected
Office for National Statistics data published in February 2026 confirmed that 957,000 people aged 16 to 24 were not in education, employment or training in the October to December 2025 quarter, representing 12.8 per cent of the entire age group, an increase from 946,000 in the previous quarter. The increase was driven primarily by a rise in young women entering NEET status.
PwC's supplementary analysis found that young women with low GCSE attainment have around a 25 per cent likelihood of becoming NEET, compared with about 19 per cent for young men with similar results. Health conditions affect 20 per cent of young women in this cohort, compared with 23.6 per cent of young men, and mental health pressures are rising across both groups. The effect of health conditions on NEET likelihood is most pronounced where it intersects with educational disadvantage: young women facing both low educational attainment and a health condition are almost four times more likely to be NEET than the average for their age group. PwC's analysis observed that these risks do not simply add up; they compound, and that the roots of inequality begin long before young women reach the jobs market, making early support in school critical.
The economic cost of this disengagement is substantial. PwC estimates that bringing the UK's female NEET rate into line with Germany's could add around five billion pounds to GDP, matching the Netherlands could deliver up to eleven billion pounds, and even returning to the UK's own 2021 low point would generate an additional three billion pounds in output. The UK government launched an independent investigation into the rise in youth inactivity in November 2025, alongside initiatives including a Youth Guarantee for 18 to 21-year-olds and expanded foundation apprenticeships.
|
The Compounding Trap |
|
Low educational attainment and a health condition are each a risk on their own. Together they do not add; they multiply. A young woman carrying both is almost four times more likely to be NEET than the average for her age. That is the single most important finding in the report for anyone who designs pathways, because it locates the decisive moment well before the labour market, in school, in attainment, in mental health support. By the time a disengaged young woman reaches an RTO's door, the disadvantage already has a long head start. |
4. Australia: A Rising Performer Driven by Transparency
Australia's trajectory offers a different and, in several respects, more instructive story. Since 2020, it has climbed from 19th to 10th in the index. Apart from Hungary, it recorded the largest increase in index score across all 33 OECD countries, rising 9.6 points and nine ranking places since the pandemic. PwC's own analysis noted that if the UK's improvement had matched Australia's over the same period, the UK would have placed fourth rather than 17th. The primary driver of Australia's improvement was a significant reduction in its gender pay gap, and that reduction did not happen by accident. It followed the Workplace Gender Equality Agency's decision to publicly release employer-level gender pay gap data, a reform that introduced transparency and public accountability into a space that had previously relied on voluntary action.
On 3 March 2026, for the first time, WGEA released private and Commonwealth public sector employer gender pay gaps together, with the 2024 to 2025 results covering around 8,500 employers and 1,600 corporate groups. The following table sets out the headline figures.
|
Australia gender pay gap measure |
Figure |
|
National base salary gap (ABS, 26 February 2026) |
11.5% |
|
Median total remuneration gap (WGEA) |
16.4% |
|
Average total remuneration gap, private sector (WGEA) |
21.1% (women earn 79 cents per dollar; $28,356 a year) |
|
Average total remuneration gap, Commonwealth public sector (WGEA) |
6.4% |
|
Employer mid-point |
50% of private employers have a gap above 11.2% in favour of men |
|
Index movement since 2020 |
19th to 10th, among the largest improvements in the OECD |
WGEA's analysis shows that the majority of employers reduced both their average and their median total remuneration gender pay gap over the past twelve months, and that slightly more employers now sit inside the target range of plus or minus 5 per cent while slightly more women have moved into the upper earnings quartile. The direction of travel is positive. The distance still to travel is considerable, with half of all private sector employers still carrying a gap above 11.2 per cent in favour of men.
|
Transparency Is the Lever |
|
Australia's leap up the index did not follow a major new funding programme or a legislative overhaul. It followed the publication of data. Once employer gender pay gaps were public, the question moved from the HR team to the CEO and the board, and the gaps began to close. The lesson is exact and portable: measurement that is visible changes behaviour in a way that voluntary commitment did not. It is the single most transferable finding in the entire report. |
5. The Structural Drivers: Why the Gap Persists
The structural drivers of Australia's gender pay gap are well documented in WGEA's data, and they are stubborn. The following table sets them out.
|
Structural driver |
What the WGEA data shows |
|
Pay quartiles |
Men are 1.8 times more likely to be in the highest-earning quartile; women are 1.4 times more likely to be in the lowest |
|
Industry segregation |
Over 53% of Australian workers are in gender-dominated industries, where more than 60% of employees are one gender |
|
Highest sector gap |
Construction, at 23.8% |
|
Concentrated gaps |
In financial and insurance services, construction, mining, and electricity, gas, water and waste services, four in five workplaces exceed the 11.2% mid-point |
|
Discretionary pay |
The mid-point gap on bonuses, overtime and allowances is 29.7%, down from 31.6% the previous year |
|
Leadership |
Women hold 22% of CEO positions; only health care and social assistance, an industry that is 78% female, has gender balance at CEO level |
The discretionary pay figure deserves emphasis, because it is the least visible of the drivers. A mid-point gap of 29.7 per cent on bonuses, overtime and allowances suggests that gendered assumptions remain embedded in how organisations reward performance, not just in how they set base salaries. And the significance of all of these numbers extends beyond percentages. The average annual difference between male and female total remuneration in the private sector, $28,356, compounds over a working life into a retirement savings deficit that leaves women significantly more exposed to financial insecurity in old age. The gender pay gap is not simply a workplace issue. It is a lifetime earnings issue with consequences that extend well beyond the final pay slip.
6. Transparency as a Mechanism for Change
If there is a single policy lesson from both the PwC index and the Australian experience, it is the power of transparency. WGEA's leadership has noted that the publication of employer gender pay gaps motivated employers to prioritise equality and to engage their CEO and board in ways that voluntary commitments had not achieved. More employers each year are conducting gender pay gap analyses, consulting employees and developing action plans.
But analysis without action remains a gap of its own. Of the employers who conducted a gender pay gap analysis, only around one in five developed an action plan, and a similar share developed a strategy to address workforce composition. Transparency has shifted corporate attention, but many organisations have not yet translated awareness into systematic intervention. Australia's newer requirement for employers with 500 or more employees to select and meet gender equality targets over three years is designed to close exactly this gap between analysis and action, and it is a model other jurisdictions should study closely.
7. The Connection to Education and Training: What This Means for RTOs
PwC's NEET analysis is explicit: the roots of labour market inequality begin long before young women reach the job market. Low educational attainment is the strongest predictor of NEET status for young women, health conditions are the second, and when both intersect the compounding effect is severe. In Australia, the VET sector is the primary pathway for many young people who do not follow a university trajectory, and it is the sector best positioned to reconnect disengaged young women with education, skills and employment through accessible, flexible, workplace-integrated training. PwC's research notes that boys with low qualifications are more likely to move into better-paid, male-dominated sectors such as construction that have accessible routes into work, while girls with equivalent attainment often face fewer accessible pathways, reflecting deep-rooted gendered patterns that begin long before recruitment.
This makes the design of VET pathways a gender equity issue, not only a skills issue, and it points to three obligations for providers. First, design for the barriers young women actually face: caring responsibilities, mental health needs, financial constraints, geographic isolation, and the need for safe and supportive learning environments. A training system that is structurally inaccessible to half the population is failing at its most fundamental purpose. Second, disaggregate the data. Enrolment, completion and employment outcomes should be broken down by gender and analysed with the same rigour WGEA now applies to employer pay gaps. Third, act on what the data shows. If a provider's female completion rates are significantly lower than male rates, that is not a student problem but a system design problem, and just as transparency has driven change in the employer pay gap space, transparency in training outcomes can drive change in how providers design, deliver and support participation.
|
A System Problem, Not a Student Problem |
|
If a provider's female completion rates sit well below its male rates, the explanation is rarely the students. It is the design: the timetable that assumes no caring responsibilities, the placement with no safe pathway, the support that was never built. Disaggregating outcomes by gender is the training sector's equivalent of publishing the pay gap. It makes the problem visible, and visible problems get fixed. The data an RTO already holds is the starting point. |
Conclusion: The Economics of Equality
The sector's experience across decades shows what happens when systems invest in women and what happens when they do not. The difference is never marginal. It is transformative, for individuals, for families, for communities and for entire economies. Australia's experience demonstrates that change is possible when transparency creates accountability and accountability drives action, and the countries that consistently lead PwC's index prove that sustained policy commitment to childcare, parental leave and workforce participation produces measurable, lasting results.
PwC's index is a scorecard. WGEA's data is a mirror. What matters is whether the sector acts on what they show. An economy that underinvests in women is not just an unequal economy. It is a smaller one. And in 2026, the data is too clear and too costly to ignore. Young Australians and young Britons alike are watching, and they can see the gap between political rhetoric and lived reality. When nearly one million young people in the UK are disconnected from work and education, when more than half of Australian employers still carry a gender pay gap above 11.2 per cent, and when four in five workplaces in some of Australia's highest-paying industries have gaps above the national benchmark, the message received by the next generation is that the system talks about equality far more than it delivers it. The question for every government, every employer, every training provider and every institution that shapes the conditions of women's participation is whether they are willing to match recognition with reform at the pace and scale the evidence demands. Because the evidence is no longer emerging. It has arrived.
|
Summary: The Rising Cost of Leaving Women Behind |
|
1. Progress on workplace gender equality across 33 OECD nations has slowed to its weakest level since the pandemic, driven by falling full-time work for women and rising unemployment. 2. The index leaders, unchanged for five years, share supportive parental leave and affordable childcare: Iceland, Luxembourg, New Zealand, Sweden and Slovenia. 3. The UK rose to 17th and top of the G7, but mostly because others slipped; its female unemployment recorded the largest rise since 2011. 4. Nearly one million UK young people (957,000, or 12.8 per cent of 16 to 24-year-olds) are NEET, with the rise driven by young women. 5. Low educational attainment and a health condition compound: a young woman with both is almost four times more likely to be NEET than the average for her age. 6. Australia climbed from 19th to 10th since 2020, among the largest improvements in the OECD, driven mainly by a narrowing gender pay gap. 7. That progress followed the publication of employer-level pay gap data, not new funding: transparency proved to be the lever. 8. Australia's private sector average total remuneration gap is 21.1 per cent, or $28,356 a year, and half of private employers still carry a gap above 11.2 per cent. 9. Structural drivers persist: industry segregation, a 29.7 per cent mid-point gap on discretionary pay, and women holding just 22 per cent of CEO roles. 10. For VET, the design of pathways is a gender equity issue: design for the barriers young women face, disaggregate outcomes by gender, and act on what the data shows. |
References and Further Reading
PwC UK (2026). Women in Work Index 2026. https://www.pwc.co.uk/services/economics/insights/women-in-work-index.html
PwC UK (2026). UK Regains Top-Ranking G7 Position in PwC's Women in Work Index (Press Release, 2 March 2026). https://www.pwc.co.uk
Workplace Gender Equality Agency (2026). Employer Gender Pay Gaps Report 2024-25 (3 March 2026). https://www.wgea.gov.au/publications/employer-gender-pay-gaps-report
Workplace Gender Equality Agency (2026). Gender Pay Gap Data. https://www.wgea.gov.au/pay-and-gender/gender-pay-gap-data
Workplace Gender Equality Agency (2026). Publishing Employer Gender Pay Gaps (3 March 2026 release). https://www.wgea.gov.au/what-we-do/publishing-employer-gender-pay-gaps
Australian Bureau of Statistics (2026). Gender Pay Gap Data (26 February 2026). https://www.abs.gov.au
Office for National Statistics (2026). Young People Not in Education, Employment or Training (NEET), UK: February 2026 (October to December 2025 data). https://www.ons.gov.uk
House of Commons Library (2026). NEET: Young People Not in Education, Employment or Training. https://commonslibrary.parliament.uk